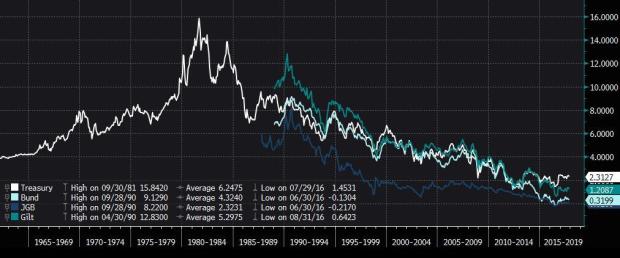
Should you be holding longer- or shorter-term Bonds? As we know, this depends mainly on factors such as inflation and the level of economic activity in the case of developed markets government bonds as default risk is usually very low. Central banks will raise the benchmark interest rate if inflation is at target (usually 2% in developed economies) and economic growth is sound. Since central banks control short-term interest rates, shorter maturity bond prices will fall if policy rates increase. What happens to long-term interest rates? Long rates are influences mainly by supply and demand dynamics of the bond market. If the market thinks that inflation will rise, future cash flows will be worth less and investors will demand a higher premium to compensate for the loss in purchasing power so that long-term interest rates will rise too. Hence, monetary policy and markets’ inflation expectations will tell us which part on the yield-curve is most compelling at any point in time. Needless to say, monetary policy does not change month over month. However, interest rates can move substantially within a short period of time as we can see below for various 10-year interest rates.
Why is this? Market perceptions of either the path of monetary policy or inflation expectations can change rapidly. What variables drive these changes in expectations? Ideally, we want to have leading drivers rather than concurrent so that we do not need to rely on forecasts.
To start with, let’s focus on the US market and the manufacturing PMI, which is often considered a leading economic indicator. We also know that the indicator largely affects market perceptions for economic growth. Keep in mind that although manufacturing is not a very large component of GDP in the US anymore, it still provides signals about economic growth, as the manufacturing sector is usually where recessions begin and end. A reading above or below 50 indicates an expansion or contraction in the economy. The indicator is a survey-based measure and has five components: new orders, inventory levels, production, supplier deliveries and employment environment. The hypothesis is that whenever the PMI increases or decreases month over month, it sends a bullish / bearish signal to the market and perceptions might change. In other words, when the PMI signals expansion, the market perception of the health of the economy increases. As a result, the Fed is more likely to raise policy rates all else being equal.
Given that we identified a candidate indicator for taking duration views, how do we assess whether we have made the correct decision? We will look at longer-term bonds (10 year) because we are interested in the effect of shifting our duration from longer-term bonds in order to protect against rising rates rather than finding the sweet spot on the curve. Hence, we measure whether the yield on the long bond has increased or decreased over the following month on a total return basis. Note that the PMI, unlike other economic indicators, provides timely data (first business day of each month) and is not subject to revision which makes it eligible to use as an indicator.
Is the PMI successful in providing signals for duration views going forward? A 56.4% hit-ratio (% of correct predictions) for the US indicates that it does work..
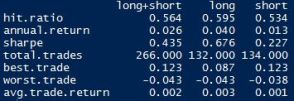
Given that we have been in a bond bull market since the 1980s it is crucial to differentiate between long and short signals to evaluate the performance. As we can see, the manufacturing PMI seems to provide consistent and reliable duration signals for both, long and short. Is this random and we were lucky or is it significant? One could answer that statistically or economically. Let us look at it from an intuitive perspective; if the indicator is reliable it should work for other markets as well. Does it work for other markets?
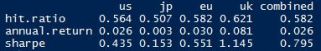
It looks as manufacturing PMI is a reliable indicator for duration views globally but for Japan (50.7% hit-ratio). Why does it not work in Japan? Due to limited data availability we could perform the test for Japan only for the last couple of years (62 trades in total). As a result, the short signals have performed very poorly, likely due to unconventional monetary policy during that period. However, we will still use it as an indicator since the economic rationale is strong and given that it also works for all other markets.
Note that we do not perform any regression analysis. It would be an interesting alternative approach as it would provide you additional information about signal strength etc. However, for the sake of simplicity, we shall simply use the change in PMI to construct the signal.
What other variables are there that we need to take into account when forming duration views? We consider variables from five broad categories to diversify the signals and provide a perspective from different angles.
- Demand
- Activity
- Momentum
- Valuation
- Risk
When demand in the economy is improving (as measured by PMI for example), market perceptions change and inflation expectations generally improve as well as the outlook for the economy. Hence, if we see and improvement in demand, we go short duration. Activity is somewhat related to demand but different as it includes hard data. But the rule is the same as with the demand indicator. Momentum is straightforward; we go long / short duration if the underlying momentum is positive / negative. Valuation considers more strategic or longer-term variables that are slower moving but still important. The rule here is simple, if the long-term bond is valued significantly higher than where it should be, we go short duration and vice versa. The final indicator is a risk indicator which measures the anxiety in the market. The more uncertainty there is, the higher interest rates tend to be so we would take a short duration position.
Each of the categories has multiple indicators in order to increase robustness of the model. We don’t want to rely on a single variable to get a signal from the demand side for example. In total, we have ten variables going into the model each providing an independent signal. This means that we have information about signal strength ranging from -10 (maximum short) to +10 (maximum long). What is the performance of the overall model across regions?
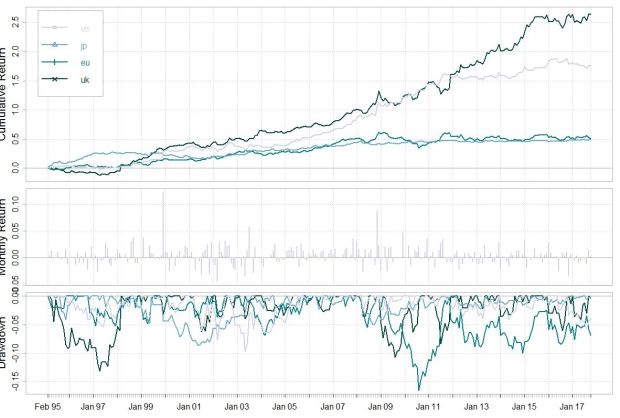
Historically, the model performed well for both the long and short side. A systematic approach to trade duration seems to work best in the US and UK market. Of course, we might not find duration views very interesting (even tactically) in markets such as Japan where the BoJ has still to reverse its negative interest rate policy. However, the model has worked across markets for the past 20 years and it should be working going forward given the conviction in the economic rationale.
What’s the duration view currently?
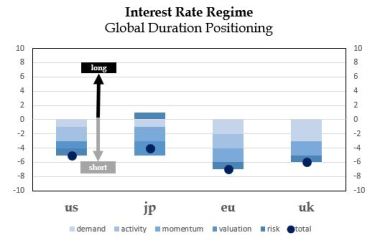
The model signals a short duration position across markets, mostly so in Europe with a signal of -7 (out of -10). All indicators from demand to risk signal a short duration position in Europe. What was the duration view over the year globally?
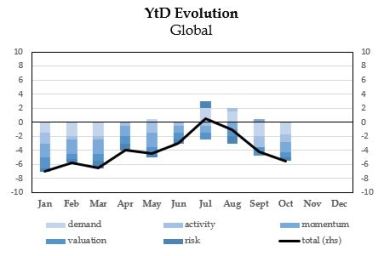
For most of the year, we have been positioned short duration although the trend was trending towards neutral in the second quarter of the year but reversed more recently. With central banks globally starting to put QE on hold having accumulated ~$15 trillion of assets on their balance sheets (Fed, BoJ, BoE, ECB) and given the rising policy rate environment, this view seems to make sense.
